
Navigating the Business Cycle: The Tide is Going Out
Last week, we zoomed out as far as possible to the 80-100 year Long-Term Debt Cycle. We argued that the global system is navigating the later stages of that cycle: fiscal stress, institutional erosion, and rising geopolitical competition. Our central thesis remains that today’s environment looks like a mix of 1914's geopolitical fragility overlaid with 1930s economic fragility.
Today, we zoom in.
We are keeping the same map, but changing the scale. We are now looking at the Business Cycle — the 5-6 year rhythm that sits inside the larger wave. Understanding where we are in this cycle tells you practically what is likely to happen to markets over the next 12-24 months.
A Quick Recap: The Two Clocks
Think of the economy as being driven by two clocks ticking simultaneously:
- Clock 1 — The Long-Term Clock (80-100 years): This tracks the rise and fall of entire monetary regimes and world orders. As we discussed last week, this clock is in its final chapters. Debt is systemically unpayable, institutions are losing legitimacy, and the global order is fracturing. The direction of travel is set.
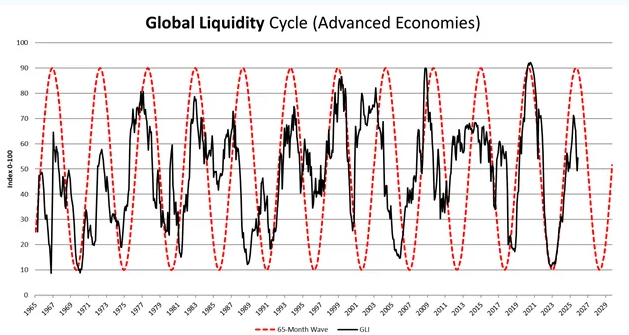
- Clock 2 — The Short-Term Clock (5-6 years): This is the rhythm traders, investors, and everyday people feel most directly. It is the cycle of credit expansion and contraction. It tracks when money is easy to borrow, and when it suddenly becomes hard. Asset prices rise on a tide of liquidity, and fall when that tide goes out.
The Engine of Our Economy: Debt and Liquidity
Before we go further, let me explain the single most important concept that most investors misunderstand.
Our entire economic system runs on debt. Not savings. Not gold. Debt.
And debt is almost never actually repaid; it is refinanced. Institutions borrow money, and when it comes due, they borrow again to pay it back. The system works as long as there is always enough money available to keep refinancing.
That "money available" is called liquidity. When liquidity is abundant, asset prices rise, businesses invest, and people spend. When liquidity tightens, the reverse happens — and it happens fast.
Consider this staggering reality: Of all the debt generated in recent years, approximately 85% is simply used to refinance existing debt. Only the remaining 15% represents genuinely new debt entering the economy to fund new growth or businesses.
This statistic reframes everything. The system is no longer a machine for creating; it is a machine for surviving. Taking out new debt today is the economic equivalent of opening a new credit card to pay off an old one. The dependency on continuous liquidity just to keep the wheel turning is absolute.
Two Sides of the Same Coin
Debt and liquidity are not separate forces. They are the same force, viewed from opposite ends of the transaction. Every dollar of credit extended is a dollar of liquidity added. Every dollar of debt destroyed is a dollar of liquidity removed.
When you layer in the 85/15 reality, the picture becomes sobering. If the overwhelming majority of new debt is merely recycling old debt, the system is running harder and harder just to stay in place.
The short-term debt cycle is, at its core, a liquidity cycle. It expands for roughly 4 years, peaks, and then contracts. The data now strongly suggests that we have peaked, and the contraction has begun.
The Three Forces Draining the Engine
What is pulling liquidity out of the system right now? Three primary drivers are operating simultaneously:
Force 1 — The Burden of Borrowing Costs
In 2022, U.S. 10-year Treasury bond yields broke a 40-year downtrend. Last week, the yield broke decisively above a key descending trendline. The bond market is effectively calling out the U.S. administration on its fiscal policy.
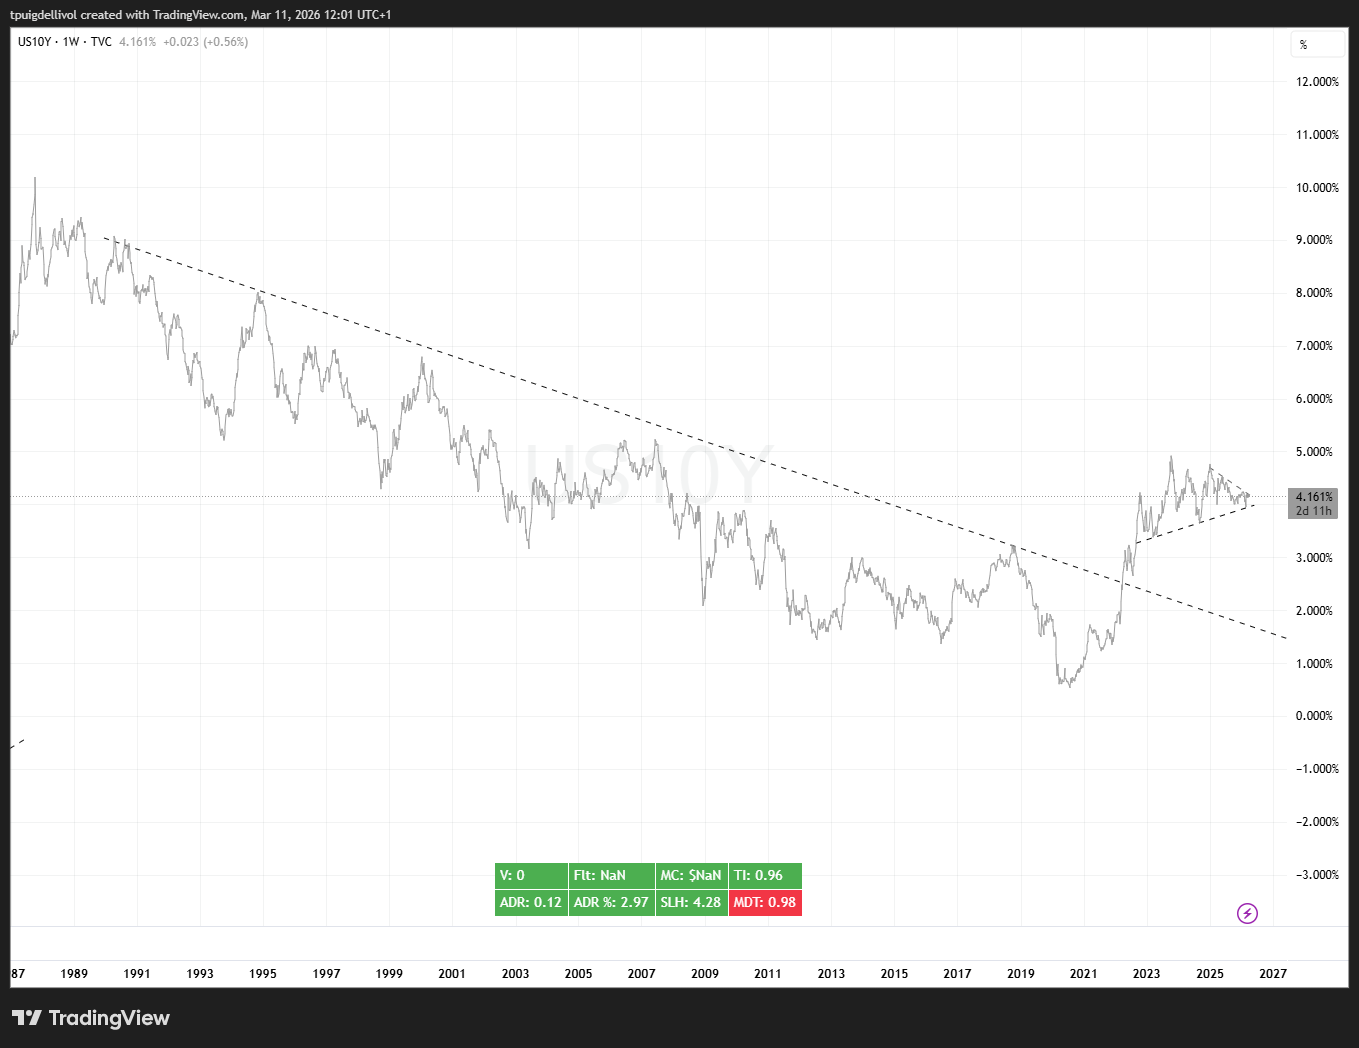
Investors are pricing in a deteriorating fiscal trajectory for the U.S., and the consequences of a prolonged geopolitical conflict on a stretched balance sheet. Because U.S. Treasuries serve as the collateral backing roughly 75% of all global debt, falling bond prices (rising yields) shrink the value of that collateral. When collateral loses value, the global capacity to refinance shrinks with it.
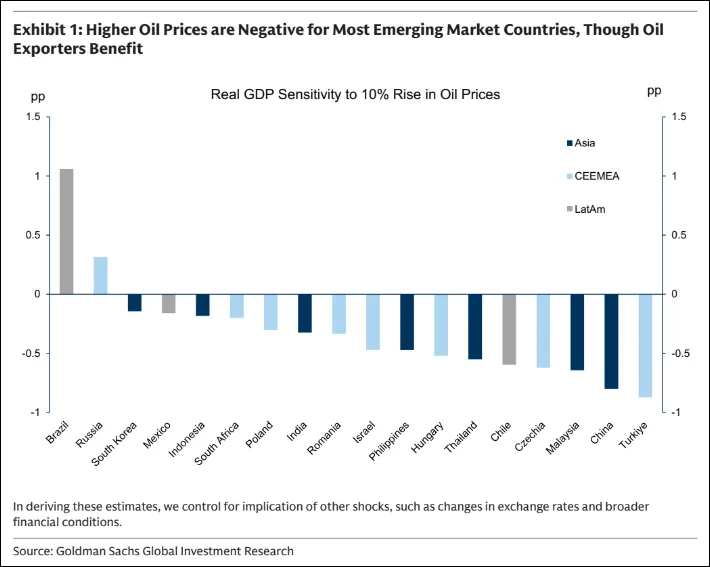
Force 2 — The Global Energy Tax
Rising energy costs act as an invisible tax on the world. But there is a deeper mechanic: crude oil is priced in U.S. dollars.
When oil gets more expensive, every country outside the U.S. has to work harder to earn dollars to buy it. That leaves less money for everything else, including servicing existing debts. This creates a tightening spiral: higher energy costs → greater demand for dollars → tighter global financial conditions → less available liquidity.
Force 3 — The Debt Maturity Wall
During the pandemic, governments and corporations borrowed massive amounts of money at rock-bottom interest rates. That borrowing came with a maturity date, and that clock is now going off. Trillions of dollars in debt are coming due. Refinancing this debt today is like renewing a 2% mortgage at 6%. The interest burden is exploding overnight.
The First Cracks Are Visible
When liquidity tightens, the most vulnerable parts of the system break first. The early warning signs are here:
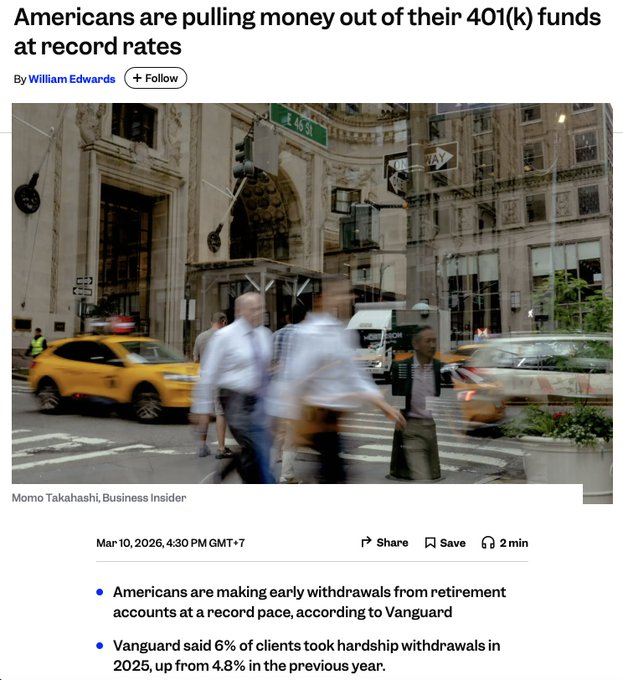
- Retail Exhaustion: Weekly investment purchases have dropped 30%, and ETF inflows are down 22%. Retail investors are showing "persistent fatigue."
- Private Credit Stress: The private credit markets, which expanded enormously to replace traditional bank lending, are beginning to show strain. The liquidity shortage is moving from the periphery to the core.

Volatility: The New Baseline
All of these factors converge into one reality: markets are becoming increasingly volatile.
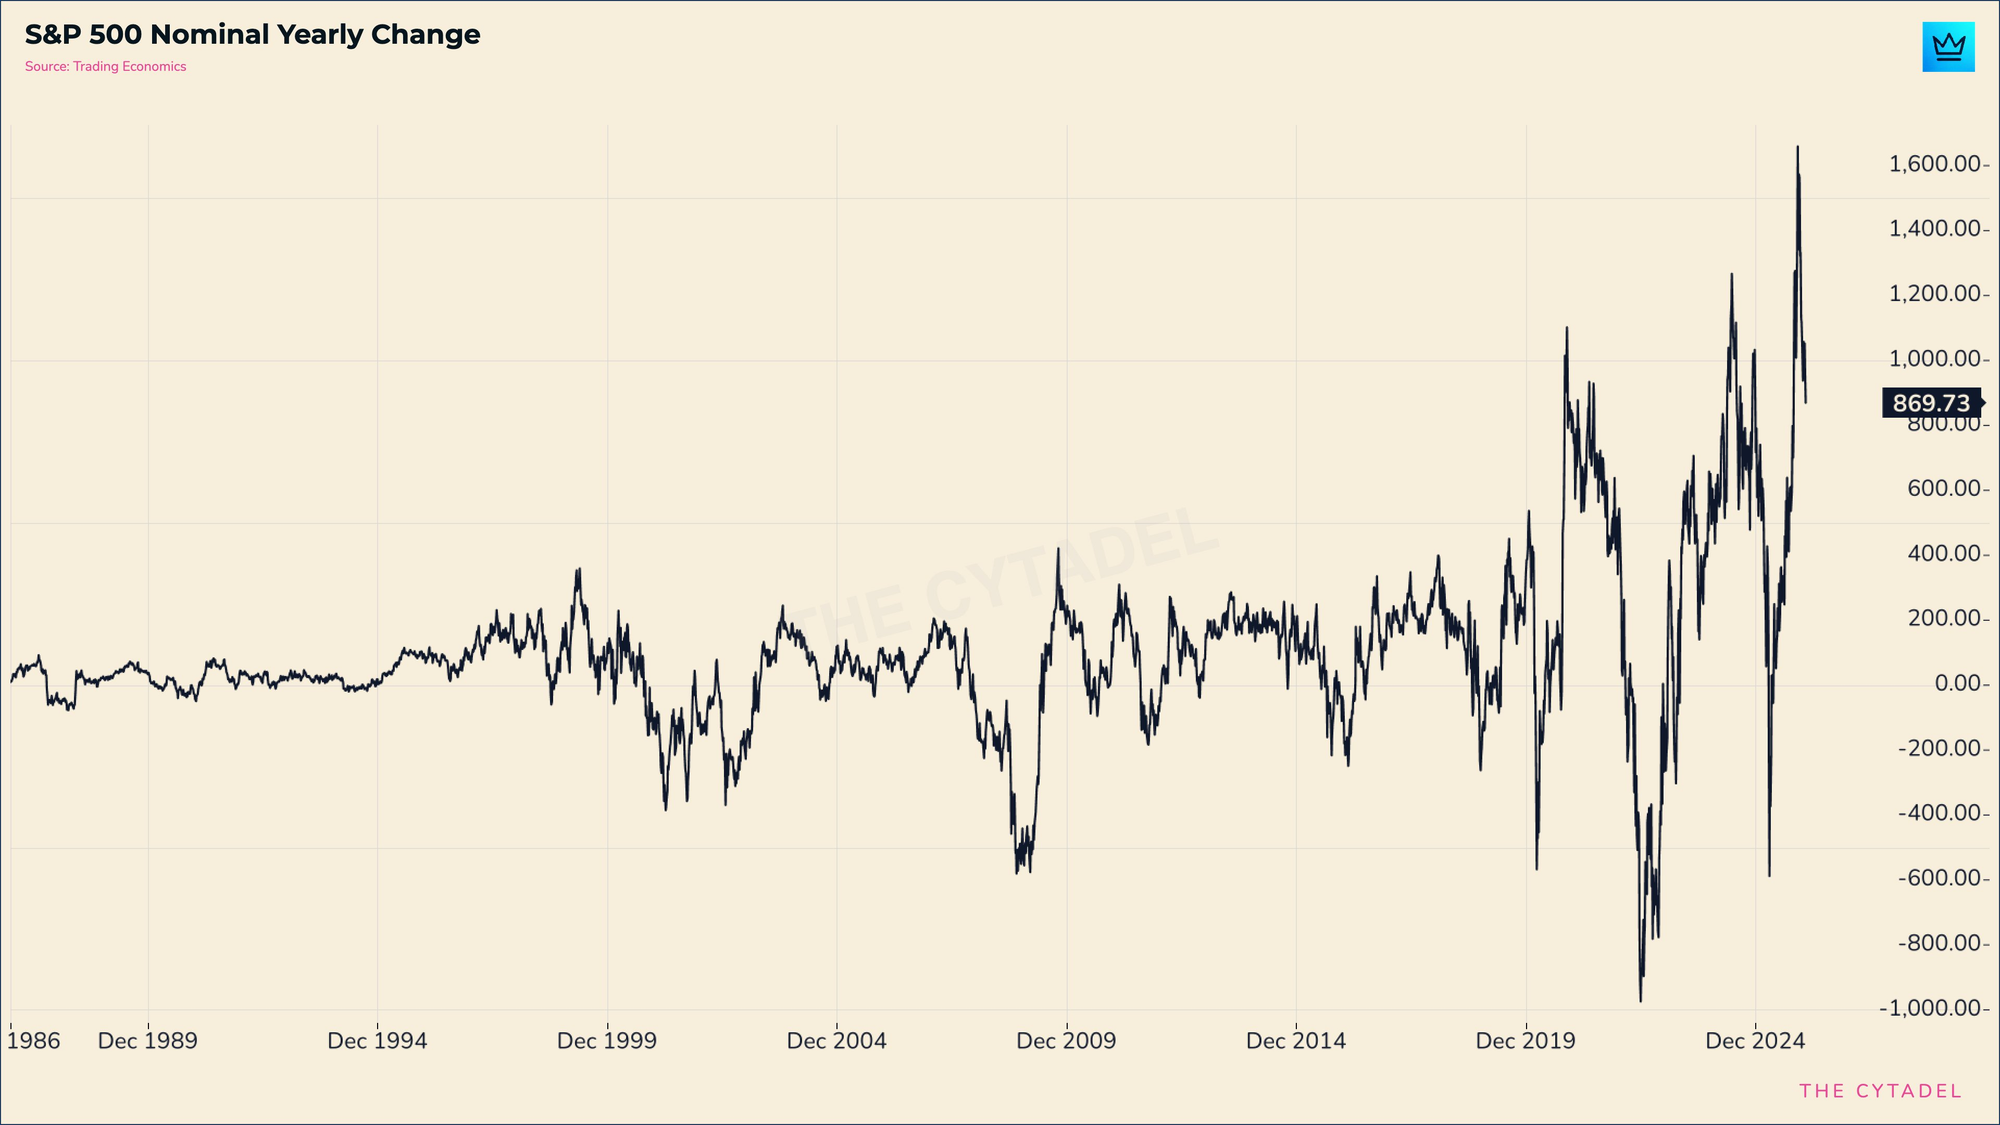
The 40-year era of buying a diversified portfolio and holding it through steadily expanding liquidity is over. Volatility is no longer an anomaly; it is the baseline. The investors who succeed will be those with frameworks to identify trends early and recognize when they reverse.
The AI Wildcard: Deflationary Pressure Inside an Inflationary System
Artificial Intelligence is a deeply deflationary technology arriving inside a highly indebted system.
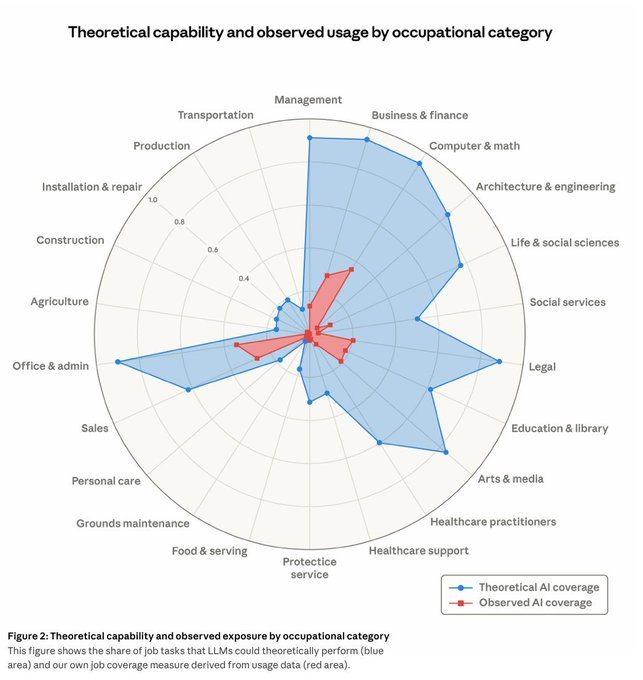
To manage massive debt burdens, governments must use financial repression (inflation) to shrink the real value of that debt over time. But AI is simultaneously driving costs and wages down:
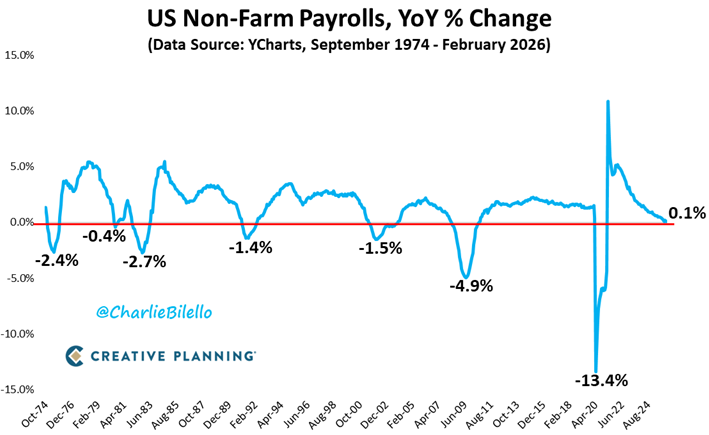
- Job Weakness: Total U.S. job growth over the past year is just 0.1% — a level historically seen only during recessions.
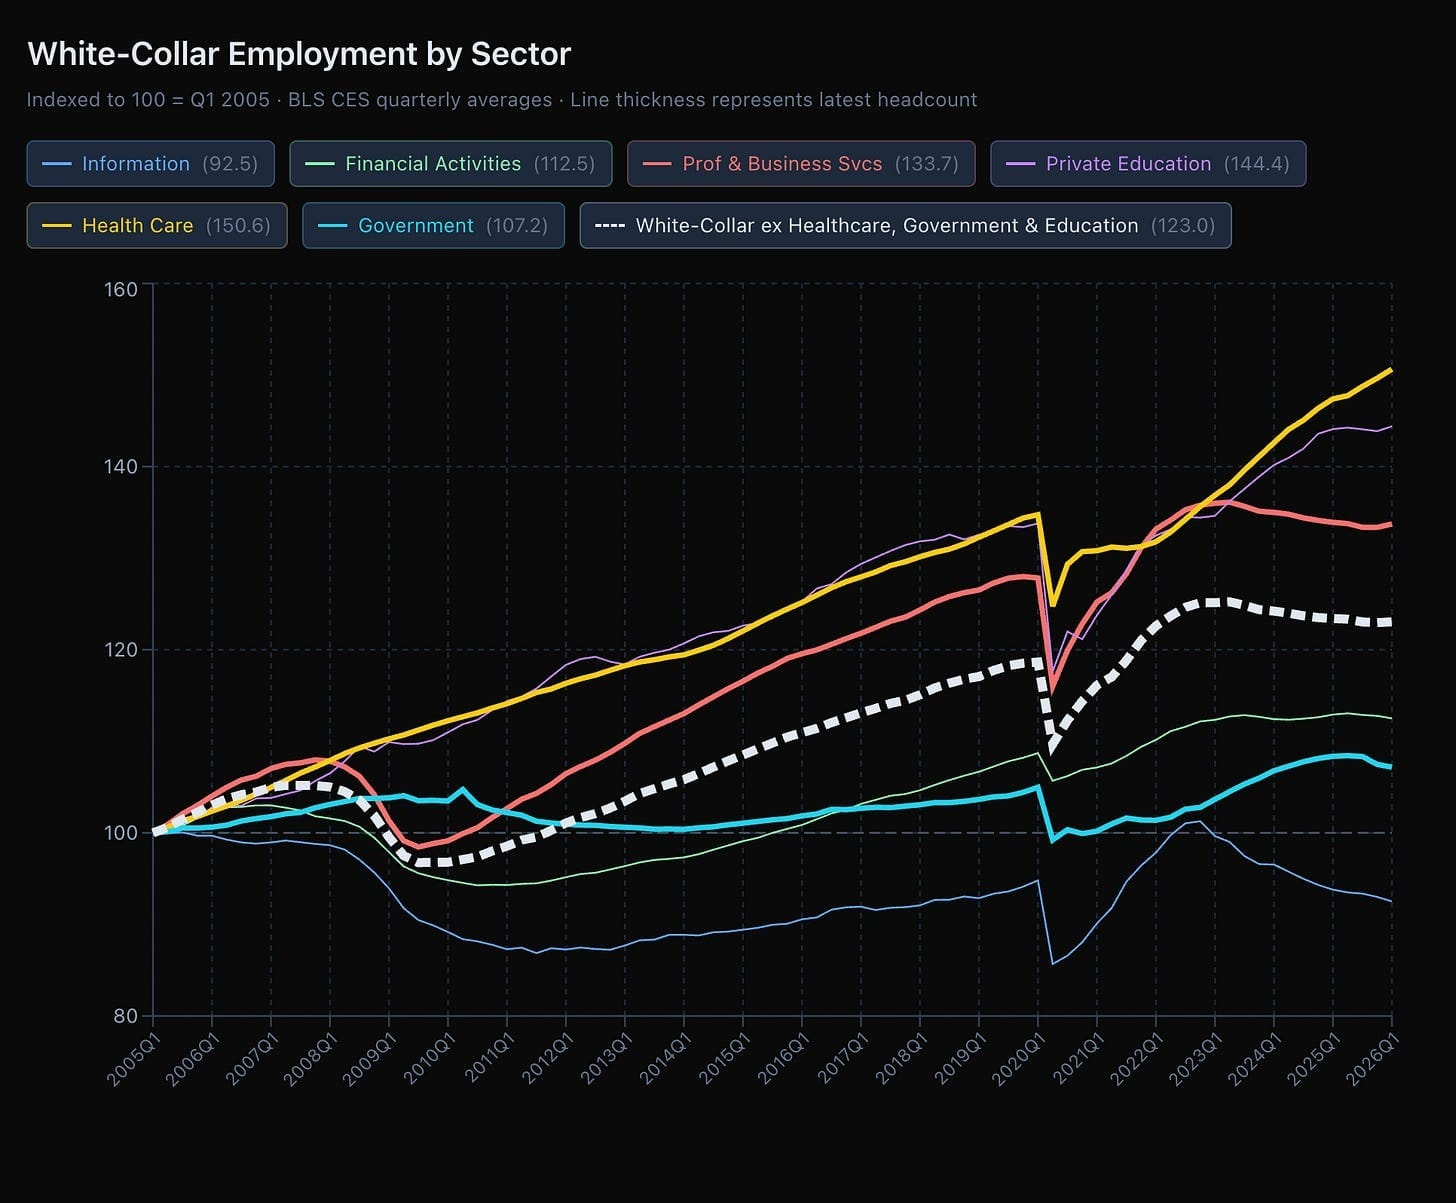
- White-Collar Stagnation: Core white-collar employment has been stagnant since 2023.
- Tech Sector Losses: The Information sector, the supposed beneficiary of the AI boom, has shed 8% of its jobs from peak levels.
As high-paying jobs disappear, consumer spending contracts, tax revenues fall, and government deficits widen. The fiscal cost of AI-driven unemployment could be enormous, arriving exactly when the government's capacity to absorb it is exhausted.
Putting It All Together:
The long-term cycle says: the system is structurally close to exhaustion. The business cycle says: the tide is going out right now. Given this alignment of cycles, here is how we are thinking about the near-term landscape:
1. Passive investment strategies will face significant headwinds. The era of index-fund-and-forget-it is not suited. Systems that can ride trends and step aside when they turn are what this environment rewards.
3. The rotation toward real assets is rational. As we noted last week, gold, commodities, and tangible assets are outperforming. This is not a temporary trend — it reflects a fundamental repricing of assets in a world where paper promises are becoming less credible. We believe this rotation has significant further to run (3 to 6 months).
4. Capital preservation is not timidity — it is strategy. In a liquidity contraction, the discipline to protect what you have built is the foundation for being able to deploy capital when genuine opportunities emerge on the other side. The investors who survive downturns intact are the ones who can take advantage of the recovery.
Looking Ahead
Next week, we move from diagnosis to prescription. In the final piece of this series, we will lay out our concrete, actionable investment framework. We will cover how we identify trends, manage risk, and position across asset classes.
The goal is not to predict the future with certainty. The goal is to understand probabilities, respect risks, and position yourself to survive the bad outcomes while participating in the good ones.
Best Tweets of the Week
if more people understood this chart exists because of broken money, things would look a lot different right now
— Jackson (@macrojack21) March 7, 2026
wealth of top 1%: parabolic
wealth of bottom 50%: flat
most people think this is about capitalism failing or greed or corporations
it's not
it's the direct result… pic.twitter.com/asS4zkMY85
Soros Fund Management CIO Dawn Fitzpatrick on why there is a massive culling coming for managers in private equity and credit
— Boring_Business (@BoringBiz_) March 7, 2026
From her conversation at Bloomberg Invest
"Investors are overallocated to private assets. Their private equity is not cash flowing, and now they are… pic.twitter.com/5Koo4Rq6nK
🚨 U.S. housing market is BROKEN
— NoLimit (@NoLimitGains) March 14, 2026
More sellers than buyers by 600,000.
That gap has never existed before. pic.twitter.com/xv2YkQWG1q
The biggest issue the US is dealing with right now isn’t Iran — it’s the cost of its own debt.
— Otavio (Tavi) Costa (@TaviCosta) March 14, 2026
Plain and simple:
The government can’t afford a war at this stage, and higher interest rates are becoming an existential threat.https://t.co/mHVMQJMS82 pic.twitter.com/yW1dmgDC7i